IconsBorder
PhoneIcon
EmailIcon
FacebookIcon
TwitterIcon

Phone: 07944 653141

A BIT OF CHART MAGIC

Many charts are to say the least- a bit dry, so here is a example of adding illustrative licence to a business chart. Conjuring the 7% out of a magicians hat.

Ian-Moores-Graphics-Maps-and-Charts-Business-Chart

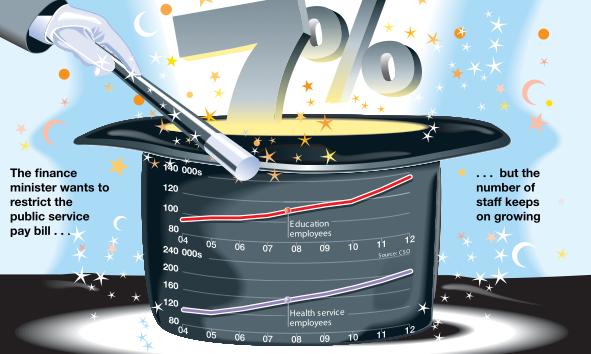
Produced for The Sunday Times Newspaper

A FEW DIFFERENT STYLES

Many mays to draw maps!

Ian-Moores-Graphics-Maps-and-Charts-Map

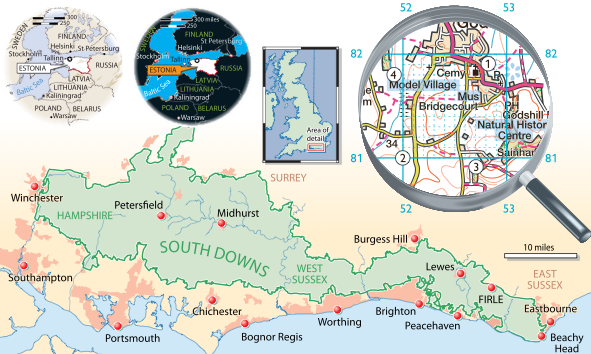
Produced for various clients

GreenFooter

Information Graphics Illustrator Kent, London, UK

Military Graphics Illustrator Kent, London, UK

Medical Graphics Illustrator Kent, London, UK

Science Diagrams Illustrator Kent, London, UK

Technical Illustrator Kent, London, UK

Maps & Charts Illustrator Kent, London, UK

Copyright © 2015 Ian Moores Graphics. All rights reserved.

Bookmark and Share